
PJM market is broadly seen as competitive, yet there is room for improvements
This is a sample article from the May 2013 issue of EEnergy Informer.
The PJM market has always been, and continues to be, a source of fascination to anyone interested in organized or competitive wholesale electricity markets:
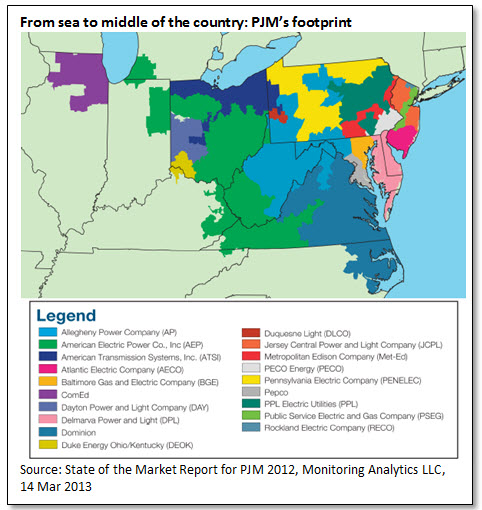
- First, it is by far the largest such organized market operating in North America, among the largest anywhere in the world, with 182 GW of installed capacity and a large geographical footprint;
- Second, PJM was among the first to introduce a number of features, such as locational marginal pricing (LMP), now common place in other markets;
- Third, PJM has introduced and successfully operates a number of markets, including capacity markets, that are extensively studied by other market operators who believe such a feature may be an improvement to their own; and
- Its performance is extensively scrutinized by an independent market monitor, Monitoring Analytics LLC, who publishes a massive annual state of the market (SOM) report as well as quarterly updates, available to anyone with plenty of time and patience to sift through.
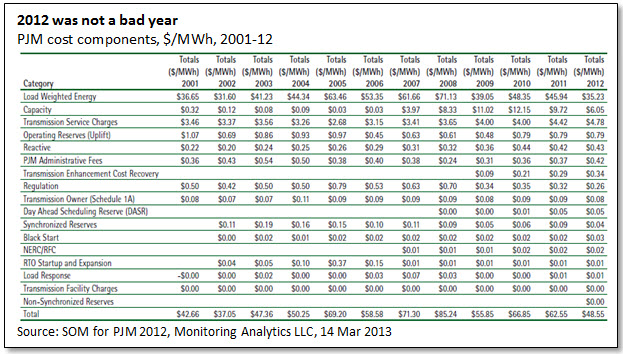
As in all competitive markets, prices vary by supply and demand conditions — prolonged and unusual heat waves, for example, create supply scarcity, resulting in price spikes. When supplies are plentiful and demand is modest, the market clears at low prices. Looking at the data for the last decade, showing the components of the prices, 2012 was not a bad year. In fact, overall, energy prices were the lowest they have been in 10 years. There was plenty of capacity and no scarcity to drive up prices.
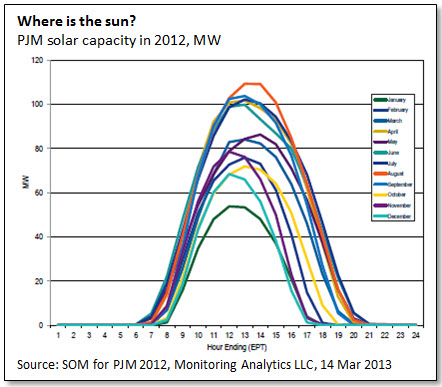
What sets PJM apart from certain other markets, such as California or Texas, is the modest penetration of renewables — even including conventional hydro. In Dec 2012, for example, all renewables accounted for roughly 5% of the installed capacity — 8,843 MW in a 181,990 MW network. This may change over time, but as shown in the figure below, PJM’s peak solar generation in August 2012 was barely above 100 MW — that is 0.06% in a system that had 181 GW of capacity in June 2012. Germany, by contrast, routinely experiences periods were solar energy accounts for more than 20% of load.
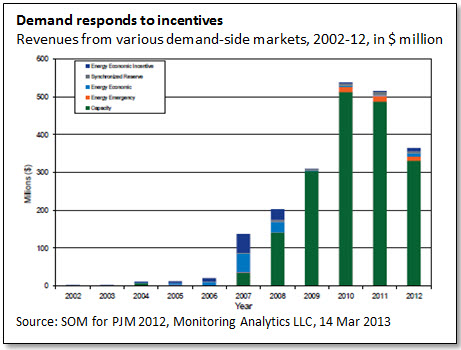
Where PJM excels is in operating a myriad of markets designed to provide opportunities to consumers and their intermediaries to engage in demand response by offering attractive compensation for reducing demand during peak demand periods. These markets have grown over time and are of sizeable significance (graph below).
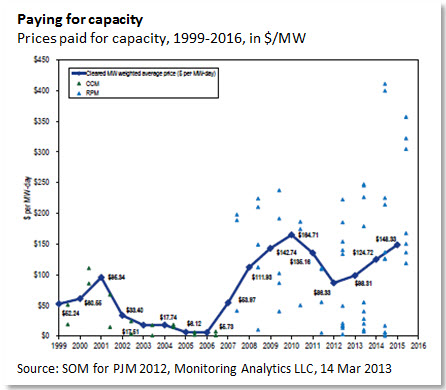
What sets PJM aside from other so-called energy-only markets is that PJM runs a multitude of markets for capacity — the details can be found at PJM website or at the SOM report. The prices paid, like market clearing prices for energy, depends on supply and demand conditions for capacity, illustrated in graph bellow.
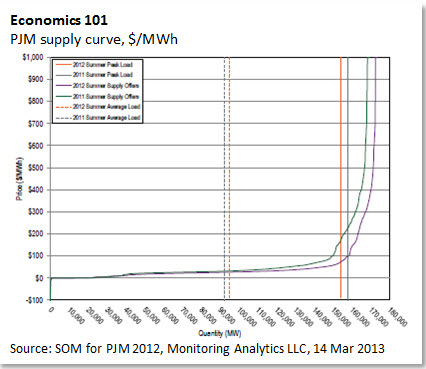
PJM’s supply curve, shown in the figure on bottom of this post, illustrates supply and demand fundamentals at work. If aggregate demand shifts to the right approaching the system’s installed capacity, prices shoot up as one would expect. When prices rise, however, incentives for demand response motivate more customers to shed load, either directly or through intermediaries. This is just as it should be. When it is cheaper for customers to shed load rather than the market operator to acquire expensive generation from peaking units, PJM favors the former. Customers gain by avoiding expensive peaking capacity.
As is customary, the 2012 SOM report comes with a list of findings and recommendations as identified by PJM’s market monitoring unit (MMU), an independent entity that is solely accountable to the Federal Energy Regulatory Commission (FERC). In its latest report, the MMU concludes that the PJM’s state of the market was good — the various markets are deemed to be operating competitively — despite the ongoing presence of structural market power. It offers a number of recommendations including:
- PJM reduces demand in the capacity market by 2.5%. The MMU recommends that this reduction be eliminated because it suppresses prices.
- PJM market rules include demand side products in the capacity market that require only 60 hours of response in a year, in contrast the required 8,760 hours of availability required of generating units. The MMU recommends that PJM eliminate the inferior demand side products from the capacity market and retain only an annual product.
- The MMU recommends that all capacity resources face the same incentives and that those incentives require that units must operate when called to receive capacity payments. The current incentive rules permit payment of 50% of capacity market revenues to generating units that do not perform.
Clearly, even a well-designed and functioning market such as the PJM can do better.
PJM’s SOM report has much more to offer than can be summarized in this space. For anyone interested in capacity markets, it describes the limitations and the downside of such markets. Like everything else in life, capacity markets come with challenges of their own.