Not quite energy independent, but less energy dependent
This is a sample article from the August 2012 issue of EEnergy Informer.
While these words are not specifically mentioned in the latest version of the Annual Energy Outlook released in June 2012 by the Energy Information Administration (IEA), leaner and cleaner may be a synopsis of America’s energy future – albeit not at a speed that some would prefer to see. Moreover, America is poised to domestically produce more of the energy that it consumes, making it less dependent on foreign suppliers. If not energy independent, at least less energy dependent.
The EIA’s fact-filled report has more to offer than the average reader can reasonably absorb. Among the highlights are reinforcements of what everyone already knows, namely domestic US production of oil and natural gas are on the rise, making America less dependent on imported oil (left graph below) and —
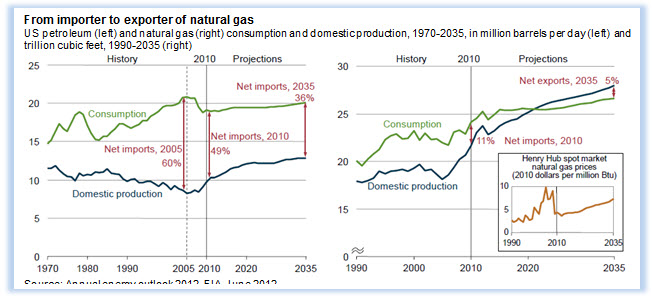
surprise — turning America into a net exporter of natural gas, perhaps within a decade (right graph above).
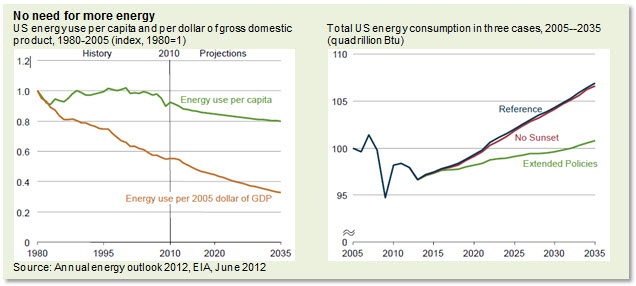
Overall energy consumption, while projected to resume its upward trend once the US economy rebounds from the recession, can be moderated if a host of so-called extended policies are put in place. Under a low-growth scenario, total US energy consumption can be maintained below its all-time peak in 2007 before the economic recession (lowest line in graph below on right). Amory Lovins has once again been vindicated — recall the review of his latest book, Reinventing Fire in the Jan 2012 issue of this newsletter. Mature economies, like those of the US, can merrily coast along, offsetting economic growth with improvements in energy efficiency — that is essentially the formula advocated by energy efficiency gurus (left graphs below).
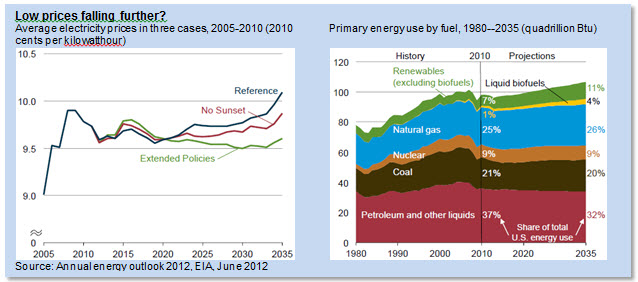
There is more good news for electricity consumers — prices need not rise by much and can be slightly lowered from their already low average levels of under 10 cents/kWhr, certainly low by comparison to Europe and many other countries. Projected low natural gas prices are a contributing factor offsetting somewhat higher costs associated with renewable generation (left graph below).
Amazingly, share of petroleum and other liquid fuels as % of total US energy consumption is projected to fall from 37 to 32% by 2035; coal’s share falls slightly; nuclear’s share remains the same. Renewables, natural gas and biofuels’ share is projected to increase over time (right graph below). The changes are gradual, of course, explained by the enormous momentum of the energy infrastructure.
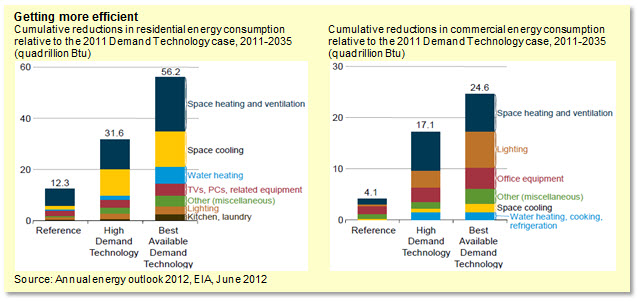
The EIA suggests that there is significant scope for reducing energy consumption in the residential and commercial sectors, the numbers are simply stunning — 56 Quads in the former and 24 in the latter by 2035 if the best available demand technologies are substituted for what is currently in use. The resulting energy efficiency savings are mostly in space heating, cooling, and ventilation plus various appliances in the residential sector (left graph below) and in space heating, ventilation and lighting in the commercial sector (right graph below). But even in the reference case, more or less under business as usual scenario, both sectors are projected to become more efficient despite low and potentially falling electricity prices. The efficiency trends are short of incredible.
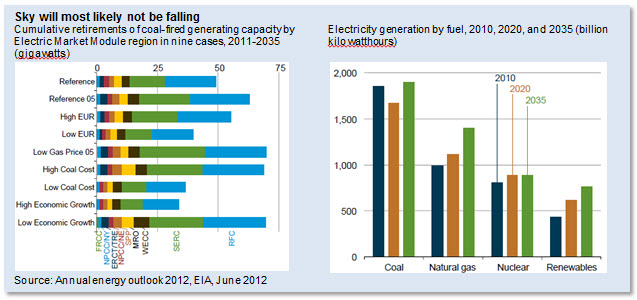
EIA examines potential retirement of mostly old and inefficient coal-fired power plants under 9 different scenarios. The impact is not earth shattering even under the direst scenario — and the sky will most likely not be falling (left graph below). Coal will still be around in 2035 and playing a rather dominant role as much as some people would wish it to go away (right graph below).
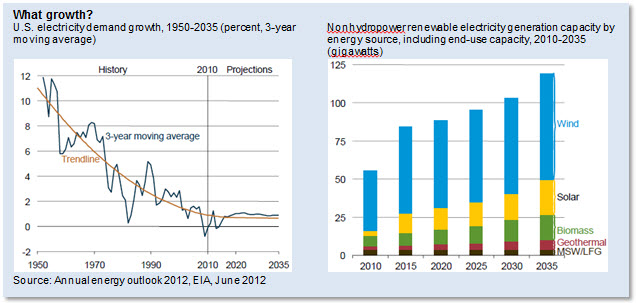
For those concerned about meeting future demand growth, there is less to worry since the growth trends are asymptotically approaching zero, having consistently fallen since 1950s with swings around the historic trend line (left graph below). A good portion of what little growth there is, and replacements for retiring units, is likely to come from renewable resources, which are projected to approach 125 GW of capacity by 2035, predominantly from wind and solar resources (right graph below).
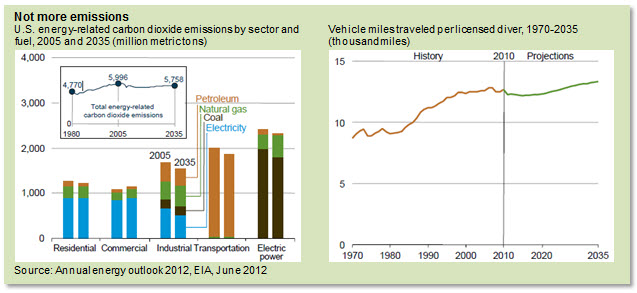
All in all, it is mostly good news for a change, including US energy-related CO2 emissions, which are projected to remain below their all-time peak of 2005 (left graph below). Even demand for personal travel — the ultimate American dream — is projected to be flat, granted at around 12,000 miles per licensed driver (right graph below).
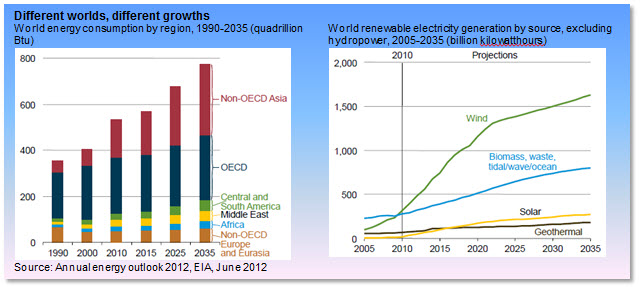
There are multiple signs of demand saturation in many areas and economic sectors. Internationally, the EIA sees continued growth in non-OECD countries, consistent with everyone else’s projections (left graph below), and continued growth in global renewable generation. The growth of wind generation, the dominant resource, however is projected to slow down beyond 2020s — no doubt reflecting less generous subsidies and/or extensive development of some of the best wind resources (right graph below).
Other studies suggest more robust global growth for renewables. Global projections are not among EIA’s major strengths.