The Energy Policy Act of 2005 requires the Federal Energy Regulatory Commission to conduct an annual survey of demand response and advanced metering in the U.S. The 12th edition of the report was released in Dec. 2017 and anyone looking for major revelations is likely to be disappointed.
Not much happens from year to year in the slow moving utility sector—and worse—sometimes things move in the wrong direction. FERC says demand response in wholesale power markets actually fell 10 percent in 2016, mostly attributed to changes in market rules in PJM, the biggest U.S. wholesale market and the one with the largest demand response program.
The report, citing data from the Energy Information Administration, says there were 64.7 million advanced electronic meters in operation in the U.S. in 2015, roughly 42.9 percent of a total 150.8 million currently in use. The numbers are rising, ever so slowly with a few states or regions far in advance of others. Nearly 82 percent of customers in Texas, for example, have electronic meters in contrast to 6 percent in Hawaii. In California, installations of advanced meters are between 81-100 percent.
Ironically, however, few are used to deliver time-of-use or real-time prices. Moreover, FERC’s latest survey concludes that in the nation’s organized wholesale markets, demand response was called on to meet 5.7 percent of peak demand in 2016—roughly a 10 percent decline from the 6.6 percent achieved in 2015.
“Since 2009, demand resource participation in wholesale markets has increased by approximately 6 percent, but has been outpaced by an approximately 16 percent increase in peak demand,” it states. That does not sound like commendable progress.
The latest report found that DR market participation fell across all ISO/RTO regions to 28,673 MW, a 10 percent decrease from 2015. That’s a level roughly equal to the one experienced in 2013 and 2014. But peak demand, which demand response is expected to meet, move or mitigate, actually grew by 3 percent from 2015 to 2016. One step forward, two steps back?
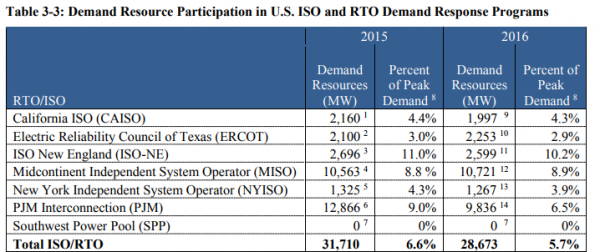
Source: Assessment of Demand Response & Advance metering, FERC Staff Report, Dec 2017
“This decrease in demand resource participation across the RTO/ISO regions was primarily due to an approximately 24 percent (3,030 MW) drop in demand resource enrollment in [the] PJM Interconnection,” according to FERCs latest report.
The report makes it abundantly clear that just as the industry needs more demand response to balance the grid due to the rapid rise of variable renewable generation, DR resources are playing a diminished role in the wholesale markets.
In the case of the California ISO, with its famous “Duck Curve,” demand response participation fell by 8 percent due to decreased enrollment in price-responsive demand programs.
“Participation in utility-sponsored programs has been gradually declining over the last several years, while participation in CAISO’s wholesale demand response products has been growing,” according to the report, which added that “In 2016, demand resource enrollment in CAISO’s two wholesale products totaled 1,480 MW.”
Demand response resources in the New England and New York ISO markets also decreased by approximately 4 percent, while it reportedly rose in the Midcontinent ISO due to an increase in capacity registered as emergency demand response. Not a rosy picture overall.
There is even less progress when it comes to time-varying rates—which were expected to follow the installation of advanced metering infrastructure or AMI. While some progress is expected—for example California’s 3 large investor-owned utilities will transition to residential default time-of-use rates by 2019—FERC notes that “barriers remain to the wide-spread uptake of time-based rates.”
State-level regulators, ever so conservative and lethargic, are concerned about customer reaction as their bills change when time-of-use rates are introduced. “In addition, a gradual transition to the new tariffs—with an opt-out for certain populations—and appropriately designed pilots to test customer response, may ease the transition,” the FERC report says. Not reassuring.
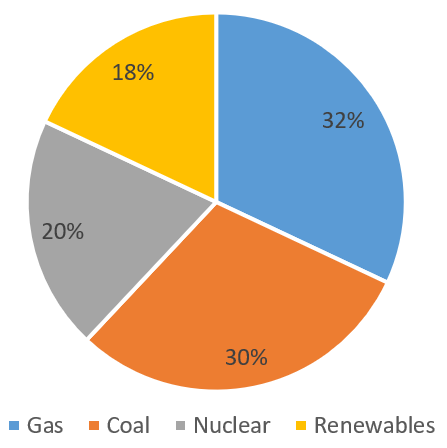
More renewable, more variable: US power generation mix, first 3 quarters of 2017, in %, Source: Energy Information Administration’s Electric Power Monthly report.
In 2015, the number of customers enrolled in incentive-based demand response programs nationwide decreased by 2 percent to approximately 9.1 million customers. On the other hand, “enrollment in time-based programs rose by 10 percent in 2015,” mostly due to progress in a few selected regions.
FERC’s report ends with a chapter titled “regulatory barriers to improved customer participation in DR, peak reduction and critical period pricing programs.” It is a sad ending to a disappointing report. Clearly, the Energy Policy Act of 2005, which was to usher in a new era of pricing electricity by time of use and other schemes to better manage peak demand, has not achieved even a fraction of what was expected.
Moreover, the need to manage peak demand, has become far more pressing and urgent—mostly because so much new variable renewable generation is being added to the network, which requires more price responsive demand.
In the meantime, billions of dollars have been spent—squandered may be the more accurate term—on millions of advanced meters, which by-and-large are doing more or less exactly as much as the dumb spinning disk meters they replaced: They measure kWhs consumed and produce a bill virtually indistinguishable from the ones Thomas Edison would have delivered to customers a century ago.
This article bt Dr. Sioshansi first appeared in CA Current.